San Diego, Calif., February 1, 2021 – Southern California Bancorp (the “Company”) (OTC Pink: BCAL), the holding company for Bank of Southern California, N.A. (the “Bank”) today reported financial results for the fourth quarter and full year of 2020.
The comparability of financial information for the fourth quarter and full year of 2020 to 2019 is affected by the Company’s acquisition of CalWest Bancorp (“CalWest”), effective May 29, 2020. Operating results for fourth quarter and full year 2020 include the combined operations of both entities from May 29, 2020.
Full Year and Fourth Quarter 2020 Highlights
- Reorganization of Bank of Southern California into the Company
- Acquisition of CalWest Bancorp (CalWest)
- Origination of $558 million in Paycheck Protection Program (PPP) loans
- Record annual revenue of $48.2 million
- Total assets increased $749 million from 2019 to $1.6 billion
- Total loans increased $557 million from 2019 to $1.2 billion
- Total deposits increased $523 million from 2019 to $1.2 billion
- Noninterest bearing demand deposits were 45% of total deposits at year-end 2020
- Nonperforming assets to total assets of 0.06% at December 31, 2020
- Consolidation of three branches for increased efficiency
- Completed private placement of common stock totaling $42 million
- Completed private placement of subordinated debt of $18 million
- Expanded Executive Management team and Board of Directors
- Continued status as well-capitalized, the highest regulatory category
“2020 was a transformational year for the Bank of Southern California, as we executed on a number of initiatives that positioned us for continued growth in 2021 and beyond,” said Nathan Rogge, President and Chief Executive Officer of Bank of Southern California. “The reorganization of the Bank under a holding company in May allowed us to acquire CalWest, which expanded our footprint into Orange County and added $312 million in assets to our balance sheet. In response to the COVID-19 pandemic, in 2020 we provided more than $558 million in Paycheck Protection Program (PPP) loans to local small businesses to keep their doors open and employees paid, and we continue to offer both first-time and Second Draw PPP loans in 2021. The acquisition of CalWest and participation in PPP grew our total loans in 2020 by $557 million to $1.2 billion at the end of the fourth quarter, with a correspondent increase in total deposits of $523 million to $1.2 billion.
“In November 2020, we welcomed the appointment of David Rainer as Executive Chairman of Southern California Bancorp and Bank of Southern California, and launched an expansion into Los Angeles County, hiring seasoned banking executives with deep roots in their local communities to support our goal of being the premier relationship-based bank for small and medium-sized businesses in Southern California. We continue to evaluate our options to increase efficiency and refine the Bank’s profile to that of a commercial banking model,” concluded Rogge.
“Nathan and his team made extraordinary strides in transforming the Company last year and building a foundation for future growth,” said David Rainer, Executive Chairman of Southern California Bancorp and Bank of Southern California. “We continue that transformation in 2021 with the addition of experienced bankers to expand our footprint and provide commercial banking services in Los Angeles and Orange counties and adjacent communities, as well as build the internal infrastructure needed to support and enable that growth. Our recently completed private placement provided an additional $42 million in equity capital to support those plans and we have also initiated a strategic business review to ensure we are delivering our products and services in the most professional manner, while providing our customers with the outstanding service they have come to expect from the Bank of Southern California.”
Full Year and Fourth Quarter Operating Results
Net Income
Net income for 2020 was $4.7 million or $0.48 per fully diluted share, compared with net income of $6.8 million or $0.78 per fully diluted share for 2019. The decrease in net income in 2020 was due to a $12.8 million increase in nonrecurring expenses. These expenses included a $4.6 million provision for loan and lease losses for the full year 2020, a $3.6 million increase over the prior year, which management believed was prudent given the current economic environment. The Company also recorded an increase of $4.0 million in strategic and other nonrecurring expenses, and $5.2 million in one-time salary and benefit expenses related to signing and retention bonuses. The increase in strategic and other nonrecurring expenses included merger and conversion expenses related to the acquisition of CalWest, the consolidation of three branch offices to increase future operating efficiency, and a one-time prepayment penalty of $2.4 million related to the early pay off of Federal Home Loan Bank (FHLB) advances.
Net loss for the fourth quarter of 2020 was $2.0 million or $(0.20) per fully diluted share, compared with net income of $1.6 million or $0.19 per diluted share in the fourth quarter of 2019 and net income of $2.2 million or $0.23 per fully diluted share in the third quarter of 2020. The loss in the fourth quarter of 2020 was related to various nonrecurring charges, as noted above.
Net Interest Income and Net Interest Margin
Net interest income totaled $45.9 million for the full year of 2020, an increase of $15.1 million or 49% from the previous year. The increase in net interest income was primarily due to the origination of $558 million of PPP loans, and the acquisition of CalWest in May 2020.
Net interest margin for the full year of 2020 was 3.66%, compared to 4.23% in the prior year. The decrease was primarily related to the yield on loans declining to 4.55% in 2020, compared with 5.47% in the prior year, which was largely due to the 150 basis points reduction in interest rates in March 2020. Additionally, yield on earnings assets declined to 4.13% in 2020, compared with 5.17% in the prior year, due to 2020’s lower interest rate environment.
Net interest income for the fourth quarter of 2020 was $13.1 million, an increase of $5.4 million or 70% from the fourth quarter of 2019. The increase was primarily due to an increase in average earning assets from the acquisition of CalWest, as well as PPP originations. Net interest margin for the fourth quarter of 2020 was 3.47%, compared with 4.01% in the same quarter of the prior year. The decline in the net interest margin of the fourth quarter of 2020 was largely due to a decrease on loan yields and average earning assets to 4.36% and 3.83%, respectively, from 5.23% and 4.88%, respectively, in the prior year.
Net interest income for the fourth quarter of 2020 was $13.1 million, compared with $13.4 million for the third quarter of 2020. Net interest margin for the fourth quarter of 2020 was 3.47%, compared to 3.60% in the third quarter. The decrease in net interest margin in the fourth quarter of 2020 was largely due to a reduction in the yield on average earning assets to 3.83%, from 4.03% in the prior quarter.
Average loan yields in the fourth quarter of 2020, excluding PPP loans, were 5.12%, an increase of 20 basis points from 4.92% in the prior quarter, primarily related to the fair value accretion of loans acquired in the CalWest acquisition. Average PPP loan yields decreased to 3.09% in the fourth quarter, compared to 3.38% in the prior quarter, due to adjustments to the Bank’s PPP loan fee accretion related to changes in cash flow assumptions on PPP loans in 2021.
Cost of funding for the full year of 2020 was 0.49%, compared to 1.02% for the full year of 2019. The decrease was related to a lower cost of deposits and other funding sources. Cost of funding for the fourth quarter of 2020 was 0.38%, down from 0.45% in the previous quarter. A detailed comparison of interest income, yields, costs, and net interest income is included in the table below:
| FY 2020 | Q4 2020 | Q3 2020 | ||||||
| Interest Income on: | ||||||||
| Total Loans | $ 50,476,783 | 4.55% | $14,255,623 | 4.36% | $14,772,183 | 4.31% | ||
| Loans excl PPP | – | – | 10,482,994 | 5.12% | 10,205,686 | 4.92% | ||
| PPP Loans | – | – | 3,772,628 | 3.09% | 4,566,497 | 3.38% | ||
| Investments | 859,462 | 2.90% | 222,737 | 2.61% | 226,211 | 2.68% | ||
| Fed Funds & Int Earning | 478,724 | 0.42% | 41,094 | 0.09% | 26,303 | 0.12% | ||
| Total Interest Income | 51,814,968 | 4.13% | 14,519,454 | 3.83% | 15,024,697 | 4.03% | ||
| Int Exp on Deposits | 3,880,133 | 0.39% | 726,717 | 0.25% | 930,474 | 0.32% | ||
| Int Exp on Borrowings | 1,989,988 | 1.04% | 648,616 | 0.94% | 693,487 | 0.99% | ||
| Total Interest Expense | 5,870,121 | 0.49% | 1,375,333 | 0.38% | 1,623,961 | 0.45% | ||
| Net Interest Income | 45,944,847 | 3.66% | 13,144,121 | 3.47% | 13,400,736 | 3.60% | ||
Non-interest Income
Non-interest income for the full year of 2020 was $2.3 million, an increase of $343,000 or 18%, compared with the full year of 2019. The increase in 2020 was primarily due to increases of $109,000 in service charges, fees and other income, and $115,000 in income from bank owned life insurance, both of which are attributable to the CalWest acquisition. Additionally, gains primarily from sales of investment securities in 2020 totaling $481,000, exceeded gains on loan sales and other gains in 2019, which combined totaled $363,000.
Total non-interest income for the fourth quarter of 2020 was $436,000, compared to $723,000 in the third quarter of 2020 and $321,000 in the fourth quarter of 2019.
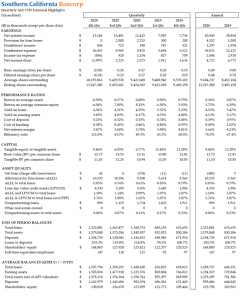
Balance Sheet
Assets
Total assets at December 31, 2020, were $1.6 billion, an increase of $749 million or 90% from December 31, 2019. The increase in total assets was related to the acquisition of CalWest, which added $312 million in total assets to the Bank’s balance sheet, and the origination of $558 million of PPP loans in 2020. Total PPP loans were $407 million at December 31, 2020.
Loans
Total loans were $1.2 billion at December 31, 2020, an increase $557 million or 82% from December 31, 2019. The increase in total loans included increases of $86 million and $455 million, in other commercial real estate and commercial and industrial loans, respectively, from the prior year. The increase in commercial and industrial loans was largely due to the Company’s funding of PPP loans.
Deposits
Total deposits at December 31, 2020, were $1.2 billion, an increase of $57 million from the end of the prior quarter and $523 million from the prior year. Noninterest-bearing deposits at December 31, 2020, were $534 million or 45% of total deposits, compared to $504 million or 44% of total deposits at September 30, 2020, and $206 million or 31% of total deposits at December 31, 2019.
Asset Quality
Total non-performing assets were $0.9 million or 0.06% of total assets at December 31, 2020, compared with $1.1 million or 0.07% of total assets at September 30, 2020.
The Company had $340,000 in net recoveries in 2020, compared with $9,000 in net charge-offs in 2019.
The Company recorded no loan loss provision in the fourth quarter of 2020, after recording a $2.0 million provision in the third quarter, and the allowance for loan and lease losses (ALLL) remained at $10.3 million at the end of the fourth quarter of 2020. The Company continues to monitor macroeconomic variables related to COVID-19 and believes it is adequately provisioned for the current environment. Management will continue to monitor and manage the loan portfolio to minimize potential future losses.
As the initial onset of economic uncertainty became clearer, many customers who elected a payment deferral have been returned to paying status; a total of $162 million in loans have reinstated their normal loan payments. Of the remaining 12 loans currently on deferral, the following table details the exposure by industry:
| Industry | Outstanding Loan Amounts
($ in 000) |
Number of Loans |
| Hotels & Food | $4,915 | 5 |
| Real Estate, Rental & Leasing | 13,478 | 3 |
| Arts Entertainment Recreation | 1,045 | 1 |
| Other | 4,968 | 3 |
| Total | $24,406 | 12 |
Relevant reserve ratios compared to the prior quarter are as follows:
| Q4 2020 | Q3 2020 | Q4 2019 | |
| ALLL to Total Loans | 0.83% | 0.76% | 0.79% |
| ALLL and Loan Fair Value Credit Marks (LFVCM) to Total Loans | 1.18% | 1.14% | 1.07% |
| ALLL and LFVCM to Total Loans, excluding PPP Loans | 1.76% | 1.88% | 1.07% |
Liquidity and Capital
The Bank has ample liquidity resources to meet its customer’s needs through both the Federal Home Loan Bank and Federal Reserve Bank’s PPP Liquidity Facility (PPP LF). At December 31, 2020, combined borrowing capacity available at both the FHLB and through PPP LF was over $350 million.
The significant growth in PPP loans in 2020 has been funded through a combination of increased DDA accounts, generally associated directly with the PPP Loans, borrowings under PPP LF, and other sources. On average during the fourth quarter, the total PPP Loan portfolio was funded through 50% DDA growth, 45% from borrowings, and 5% from other balance sheet liquidity.
PPP loans are considered zero risk-weighted assets and PPP LF advances are not counted in the leverage ratio. As such, preferential capital treatment of PPP LF advances, as well as the private placement completed in December, have helped maintain the Bank’s leverage capital ratio and total risk-based capital ratio at 12.1% and 20.4%, respectively, at the end of 2020.
FORWARD-LOOKING STATEMENTS
This news release may include forward-looking statements within the meaning of Section 27A of the Securities Act of 1933, as amended, and Section 21E of the Exchange Act of 1934, as amended, and Southern California Bancorp and Bank of Southern California (together, the “Company”) intend for such forward-looking statements to be covered by the safe harbor provisions for forward-looking statements contained in the Private Securities Litigation Reform Act of 1995. Future events are difficult to predict, and the expectations described above are necessarily subject to risk and uncertainty that may cause actual results to differ materially and adversely. Forward-looking statements can be identified by the fact that they do not relate strictly to historical or current facts. They often include the words “believe,” “expect,” “anticipate,” “intend,” “plan,” “estimate,” or words of similar meaning, or future or conditional verbs such as “will,” “would,” “should,” “could,” or “may.” These forward-looking statements are not guarantees of future performance, nor should they be relied upon as representing management’s views as of any subsequent date. Forward-looking statements involve significant risks and uncertainties and actual results may differ materially from those presented, either expressed or implied, in this news release. Factors that might cause such differences include, but are not limited to: the Company’s ability to successfully execute its business plans and achieve its objectives; changes in general economic and financial market conditions, either nationally or locally, in areas in which the Company conducts its operations; changes in interest rates; continuing consolidation in the financial services industry; new litigation or changes in existing litigation; increased competitive challenges and expanding product and pricing pressures among financial institutions; legislation or regulatory changes which adversely affect the Company’s operations or business; loss of key personnel; and changes in accounting policies or procedures as may be required by the Financial Accounting Standards Board or other regulatory agencies.
The Company undertakes no obligation to publicly revise these forward-looking statements to reflect subsequent events or circumstances.
(Click document to open PDF)

Click to Open PDF

Click to Open PDF

Click to Open PDF
Click to Open PDF